One of my frustrations (yes, I said that) as a high school special education teacher is that unfortunately, there is a large population of individuals (mostly not in education) who believe what teens are "going through" is "just a phase" or something they'll "grow out of." The reality is that what our teens are facing is REAL. It's not "dramatic" -- it's where they are right now.
These attitudes remind me of a scene in The Outsiders by S.E. Hinton. In this book, there are three brothers. The youngest brother, Ponyboy, often struggles with being understood by his oldest brother, Darry. At one point in the story, the middle brother, Sodapop, "loses it" and tries to explain to Darry that while what Ponyboy is going through or feeling right now in his life may not seem major to Darry, it is major to Ponyboy and that needs to be respected.
This semester, I was able to host a first-year college student observer. One day, he and I were chatting about the behavior of my students and what it was he was seeing, and what I was "up against" as I delivered the lesson. I explained to him each and every situation that students were going through that they had openly shared with us at one point or another.
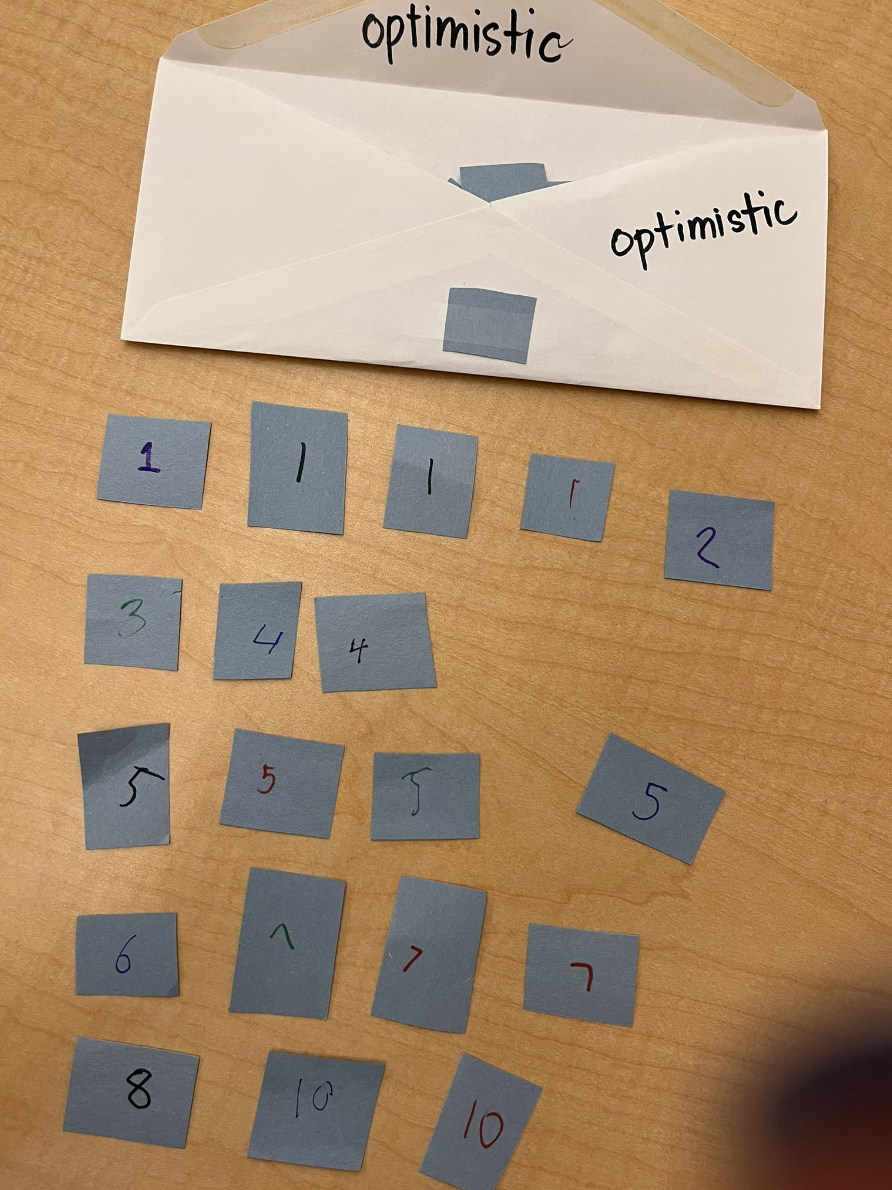
This then inspired the activity you see in the photos below. While I totally could have made this activity into a worksheet, I deliberately chose not to do so. I wanted students up and moving around. I wanted the kinesthetic for them as well as for myself as I compiled the data. You can see a breakdown of the data by clicking here and referencing this post.
My para and I sat down and made a list of emotions/feelings we feel we are seeing other than tired/exhaustion. It's a no-brainer that teens today are feeling tired. I could go on an entirely different rant/tangent indicating why I feel school hours should change. That's a post for another time.
I explained to students the activity and broke down what our rating scale meant. I also gave examples. I explained to students that we would have them anonymously rate each feeling/envelope on a scale of 1-10. I also explained to students that this rating would be how they generally feel as a whole. Inside school and outside of school. This was NOT a rating as to how they feel in my classroom.
A rating of 1 would mean "Not at all" or "This is not me."
A rating of 5 would mean they are "Feeling it for sure" but not as intense. They're more half/half.
A rating of 10 would mean "This is me" or "I am definitely HERE and feeling THIS."
I then went further and gave examples of what a 2-4 or 6-9 could mean/feel like.
Once the activity was complete, I went through each and every envelope and looked at the ratings. I find myself at a loss for words, so bare with me. While I could have easily done this activity in a worksheet or two, it was a powerful experience for me to physically open each envelope and touch each rating.
If I were to do this activity again, there would definitely be a few things I "tweak" specifically reiterating the importance of giving a proper rating. I had one student rate themselves at a "200" and I haven't a clue as to what that means. I even asked the students if they'd be willing to fess up as to who gave that rating. I'm fairly sure I know what student it was after watching body language, but I don't know for sure. I would also stress the importance of rating with only ONE number from 1-10. I had a student who rated themselves at a "zero" several times and I also had a student write "3 to 5" which wasn't very helpful.
A brief overview of results with commentary is below. As stated previously, the actual breakdown can be found here. I apologize for not making a table, I'm finding myself a bit impatient with technology lately. Again, these results are what my students are feeling as a whole {inside and outside of school} and NOT rating specifically how they feel in my classroom. I felt reassured after going over these results with students. Students told me how safe, accepted, and loved they feel when they are in my classroom. I can't even begin to explain how HEALING that was to hear. You'll see why below:
Results: (In no particular order)
Sad: 67% of my students rated themselves at a 5 or less for feeling sad. However, that is still 33% that are definitely feeling sad with a rating of 6 or higher. I had one student who rated themselves at a definite 10 for sadness
Depressed: For starters, we did spend a good amount of time talking about the difference between sadness and depression. While I was pleased to see that 56% rated themselves between a 1-4, it is still very concerning to me that 43.4% of my students rated themselves at either a 5, 6, or 8. No one rated themselves in a 9-10 range. While it was briefly comforting to notice this, it still upsets me that nearly 20% of my students were at an 8.
Anxious: 31.7% (6-10 range) of my students are definitely feeling anxious throughout their day.
Appreciated: nearly 70% of my students are not feeling appreciated. OUCH. Around 39% of my students rated themselves at the 6-10 range for appreciation.
Hungry: These results told me that the sharing fridge we have here at school is working! Twelve percent of my students rated themselves at a ten for hunger. I am willing to bet that if we did not have the sharing fridge (a fridge open all day for kids), this number would be higher.
Loved: This broke my heart. I'm just going to put it out there. 59% of my students do not feel loved. Or they're barely feeling any love. 26% of my students rated themselves at a 10 for "loved."
Frustrated: This was another half/half split. 51% of my students are definitely feeling frustrated whereas 47% of my students rated themselves at a four or less.
Proud: This also broke my heart. 71% (that's not a typo) rated themselves at a 5 or less. 38% rated themselves at a four whereas only 22% rated themselves at a 9/10.
Jealous: This actually shocked me. There's not much jealousy being admitted. 28.5% rated themselves at a one and 21.4% rated themselves at a two. Literally only one student self-rated at a ten.
Happy: Absolutely no ten ratings. :-( 19% of my students rated themselves as an 8/9 for happiness. 20% of my students rated themselves as a five. The remaining were at a four or less. Ouch.
Confident: 68.2% of my students are not feeling confident. Only 15% of my students are definitely feeling confident in themselves and their abilities. This breaks my heart and we have been discussing what barriers interfere/get in the way of them feeling confident. A student made a good point in class and stated that confidence is something you almost have to hide because you don't want other students "marking you" as arrogant or a snob.
Hopeful: 36.8% of my students are not feeling very hopeful at all. Only five of my students rated themselves in the 9-10 range.
Overwhelmed: 41% of my students are definitely feeling overwhelmed. To be honest, I expected this number to be much higher. I have many students who are juggling school and work. Not only are they juggling both, but a good percentage of my students give their paychecks to their families and rarely ever spend a dime on themselves.
Optimistic: Only THREE students feel truly optimistic rating themselves in the 8-10 range. SIXTY-TWO PERCENT of my students are NOT feeling optimistic, and yes, they know what the word means.
"Meh": We used this slang term deliberately. It means not feeling interested, just kind of going through the motions just because you have to. Twenty-two percent of my students rated themselves as a ten, and close to thirty percent rated themselves in the middle at a five.
Nervous: I had 50% of my students indicate that they really aren't feeling nervous at all. This is good! However, it breaks my heart to have heard on more than one occasion, that several of my students do feel fearful that "this will be the day" the school gets shot up. This has inspired me to ask students about safety. Stay tuned.
Understood: At the beginning of this post, I referenced a struggle that Ponyboy felt with his brother Darry. The results here definitely solidify that point. Twenty-one percent of my students gave themselves a rating of ONE for 'understood'.... in other words, twenty-one percent of my students do not feel understood. Furthermore, 31.5% of my students gave themselves a rating of THREE for 'understood.' Absolutely NO ONE gave a rating of ten. There was literally ONE response at a nine.
Unique: THIRTY percent of my students do not feel unique. :-( An additional twenty-nine percent of my students gave a rating of five. Five of my students are feeling unique and gave themselves a rating of ten. I would like to take this moment to say that ALL of my students are unique, they just don't know it yet.
Additional Information: After typing this blog and going over the results with students, we decided to do ratings on safety and exhaustion. Follow the same "tags"/labels to see those results.